We’re studying weather this week at school and one of the projects that I’m having my students do is to create their own weather report based on some weather maps that I provide for them. I didn’t go into this week with this project in mind, but after a rough day of talking too much I decided to come home and change up the next few days.
I’m not big on rubrics. I’ve got a million reasons why, but the biggest reason is that it sets up students for mediocrity and doesn’t allow them to be creative. If you can’t tell by now I’m a risk-taker in class and don’t have any problems changing it up when I feel that the class (and I) are in need of something totally different.
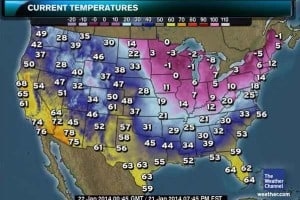
What I’m going to have them do over the next 3 days is create a professional weather report that I’m going to set high expectations for. I’m providing them with some guidelines that I want to see in the presentation, but I’m giving them some freedom as well. I felt that it was necessary to provide the 3 maps that the students will use. If time allowed, I would teach them how to go out and grab the maps themselves, but we’re in crunch mode right now. The maps that we’re using are from today’s weather and can be found in this Google Doc that I created.

I’m going to model what a superb presentation looks like beforehand. Even though I hate rubrics they need to be able to know what gets them an excellent grade. I will also model what a mediocre and poor performance look like too. It’s a great opportunity to work on presentation skills with them.
My guidelines are as follows:
In order to receive full credit you must:
-
Discuss knowledge of air masses and different types fronts, why they happen, what happens before and after the front, and show locations of fronts on the maps.
-
Point to at least 5 different cities and describe the weather there. Give a forecast for future weather in at least two of those cities. You might have to use the internet for reference because the cities are not listed.
-
Describe high and low pressure, how it’s measured, and where they can be found on the map.
-
Using the Doppler map describe the precipitation and moisture that is happening on the US map (rain and snow) Is it a lot, slow and steady?
-
Using the temperature map state today’s weather in 3 different cities than you used above. Where are the high/low temperatures in the U.S.? Forecast future temperatures for at least two of those cities.
-
BE PROFESSIONAL! Does that require different attire? Does that require acting the part? Watch the weather at home for the next couple of days and model yourself after them.
-
Think outside the box. The more original your presentation the better your grade. Can you inject humor? anecdotes? references to real-life events?
I’m hoping for sunny skies and 70 degree weather in my class next week! I’ll report back with the presentation results.
Download Over $100 in FREE Resources
For Middle School Science
Simply create a login below and gain immediate access to a selection of our Kesler Science product line worth $100 - for FREE. There's a full version of every product type! You'll also join tens of thousands of middle school science teachers who receive timely tips and strategies straight to their inbox.


