This post is a guest post from Chris Carrell. I saw an amazing demo he had setup to teach about seasons in his class and reached out to him. You’re going to love this one! Without further ado, here’s Mr. Carrell.
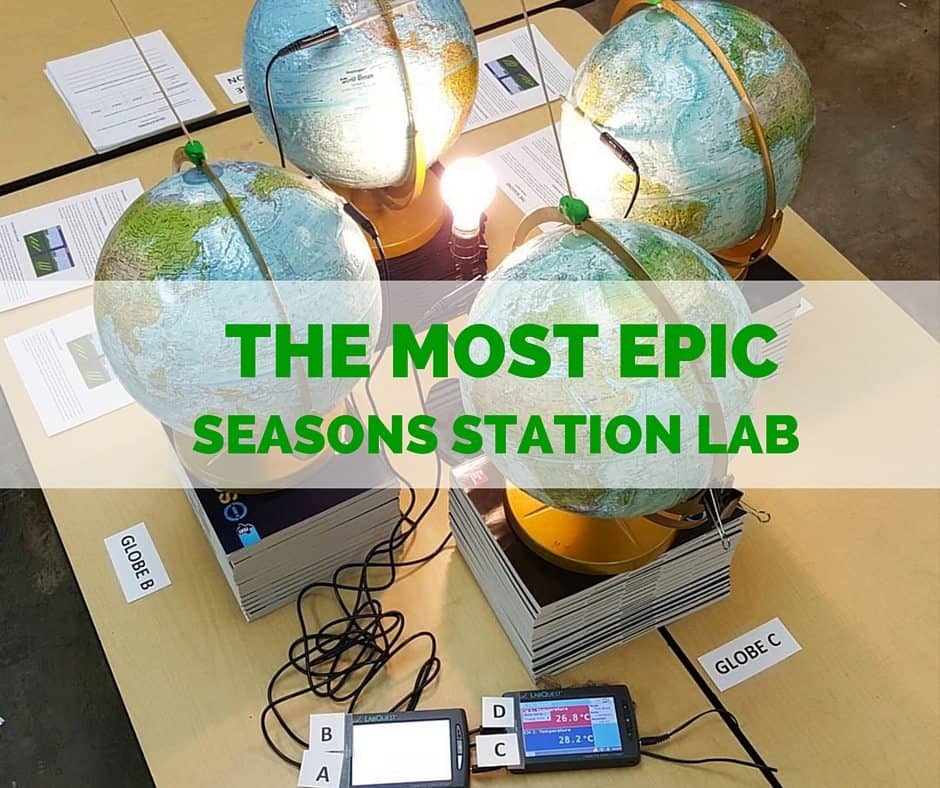
This all started with a simple Instagram post. As a “hip” science educator, I like to connect with my students through social media and show off their awesome work! I also like to use Instagram to share awesome demonstrations and cool labs (many from Kesler Science TPT Store) that we do in my class. One of my labs caught the eye of Chris Kesler, who graciously reposted my Seasons Lab setup on Facebook and Instagram. Being a huge Kesler Science fan, and seeing that Chris liked and reposted my picture made my day, week, month! The post had a reach of over 50,000 people on Facebook and numerous requests to explain the setup! In this article, I will explain and show the setup for my seasons 4-globe station lab, and detail the other stations that go along with the lab.
The Seasons Lab described in this post lines up with TEKS standard 8.7(a). My fellow 8th grade teacher, Mrs. Bailey, and I developed this lab setup during an in-service day. The hardest part students have learning about seasons is shaking the common misconceptions that seasons are caused by the Earth getting closer or further from the Sun, or that the Earth dips toward the Sun in summer and dips away from the Sun in winter. By building the model of each season together with actual temperature readings, many of our students had “ah-ha” moments just looking at the setup before they actually did the lab activity. I heard student comments like, “Now I understand direct and indirect sunlight,” and “Oh, that’s what you meant when you said the axial tilt doesn’t change.”
What Causes Seasons?
I’m going to include a short description of why the Earth has seasons. The Earth has an elliptical orbit with a radius that varies from 90 to 93 million miles from that bright thing in the sky we call the Sun. The Earth also has an axial tilt of 23.5°, which is hypothesized to have come from a rogue protoplanet the size of Mars smashing into the early Earth, consequently forming our moon. As the Earth revolves around the Sun, this static axial tilt transitions the hemispheres ever so slightly closer or further from the Sun. This concept is easily said, but not so easily understood. This is why my colleague and I developed our Seasons Lab. It allows students to see how the Earth’s tilt doesn’t change throughout the Earth’s revolution around the Sun. This tilt changes the amount of direct sunlight each hemisphere receives giving us on Earth, seasons.
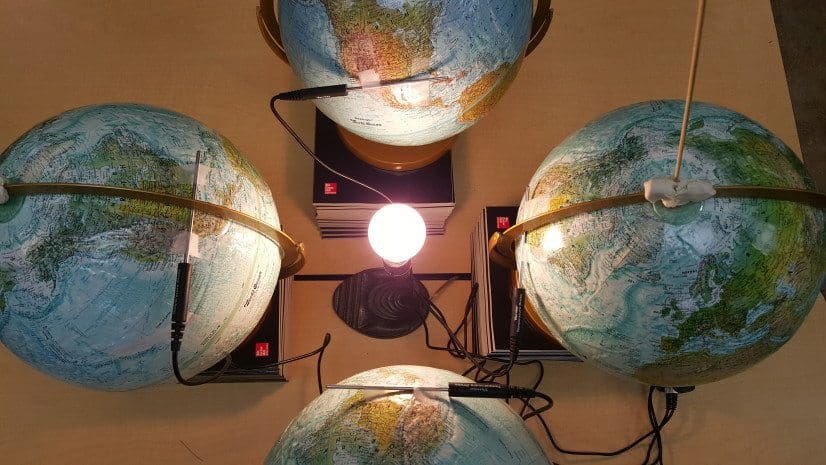
Materials Needed:
Globes (4)
Ruler
Desk lamp w/75 watt traditional light bulb
Transparent Tape
Vernier LabQuest 2 data logger (2)
Extension Cord
Vernier Stainless Steel Temperature Probe (4)
Modeling Clay
Surge protector
Wooden Skewers
Set-Up 4 Globe Lab Station: (30 minutes)
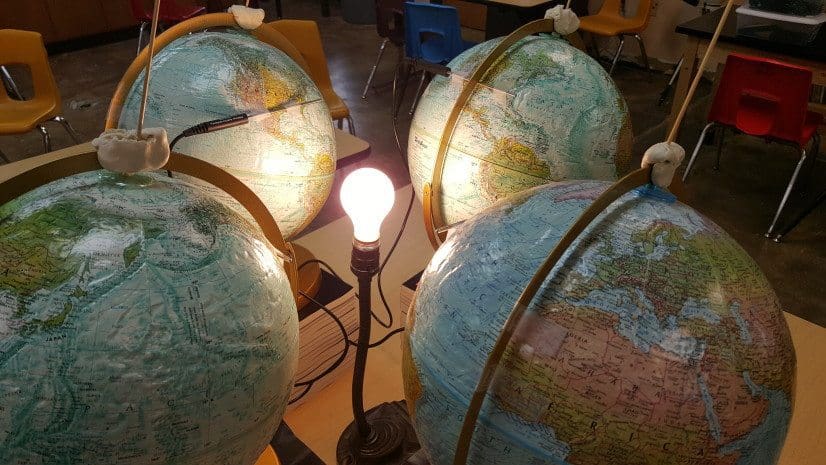
- I placed the desk lamp with a traditional 75-watt light bulb in the middle of a sturdy, balanced table. I used a traditional bulb because it puts out a lot of heat, no wonder they are so energy inefficient! Because I wanted this lab station in the middle of the classroom, I connected the desk lamp to a surge protector and extension cord (important for step 4). Pro tip#1: unplug the lamp every 2 hours or when the summer globe reads over 30°C on the data logger. This allows the light bulb to cool down.
- I then aligned the globes equidistant apart, in a cross pattern. In order to get the correct ratio of direct vs. indirect light for each globe (season), I stacked books under the globes so the equator of each globe was lined up with the light bulb. Pro tip#2: now is the time to make sure each globes axial tilt is aligned in the same direction! This is the most important step in the lab setup.
- With the assistance of Mrs. Bailey, the globes were positioned exactly 6 inches from the light bulb. Bailey held the ruler in the center of the light bulb while I positioned the globe. Pro tip #3: Position the globes before you turn on the light bulb. I learned light bulbs are bright and hot!
- Now is a good time to plug the Vernier stainless steel temperature probes into the Vernier LabQuest 2 data logger (Vernier LabQuest Information ). I made sure the temperature probes were calibrated and reading the same temperature +/- .2°C before attaching them to the globes. Pro tip#4: It’s better to find out one of your temperature probes are off by 10-15° before you attach it to your globe. I also plugged the data loggers into the surge protector because the batteries won’t last the entire day.
- I teach in Central Texas, so I taped the temperature probes at the 30° north latitude line on each globe. Because I taped the temperature probes relatively near to where my students live, it was easier for my students to relate to the lab. The temperature probes work best between the north and south 60° latitude lines. Pro tip #5: Place a couple pieces of tape connected to the globe and the metal ring on the globe. This acts as a globe brake, so when your lovely students try to spin the globe it won’t ruin the setup.
- You’re almost finished! After taking a look at the initial setup, I wanted the axial tilt to be exaggerated. I wanted my students to look at the set up and immediately realize all of the globes were tilted in the same direction. To do this, I placed modeling clay on top of the globe stand and poked a wooden skewer into the modeling clay to extend the 23.5°axial tilt. This worked great and really shows the axial tilt. Next year, I will color the skewer so it is even more pronounced!
- Finally, turn on the lamp and watch the data logger’s temperature readings. I find it amazing how realistic this model is! If setup correctly the winter temperature should read the coolest (~24°C), summer reads the warmest (~28°C), and spring and fall read in the middle and were generally the same or within .2°C of each other (~26°C). The temperatures will rise the longer the light bulb is on, but the ratios will stay the same.
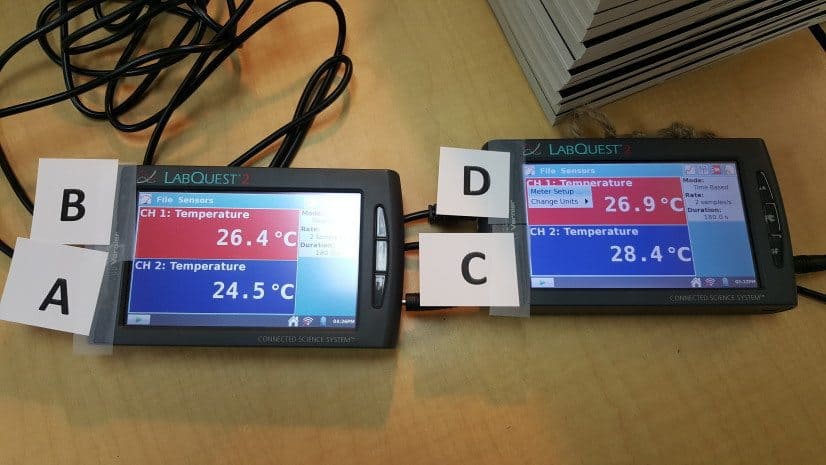
I labeled each globe and its corresponding data logger temperature reading A-D. I asked my students to determine which season each globe represented and then to sketch a diagram of the setup.
Full Station Lab
I combined this lab station with 4 other stations. Each additional station focused on 1 season. I placed a globe with the same clay/skewer setup at each lab table corresponding to the 4-globe lab station. I asked students to describe the season in their own words, using the Kesler Science Seasons INB pages. I also paired the interactive website Seasons Interactive Website to each individual seasons lab station so my students could observe and answer questions about varying temperature and hours of daylight at the same 4 major cities.
Thank you for reading and I hope you are able to incorporate this lab into your curriculum. If you have any additional questions you can contact me at ccarrell (at) llanoisd.org or DM on Instagram @mr.cscienceljhs. I would like to thank Chris Kesler for allowing me to be a guest blogger and share my lab with his loyal followers. He has and continues to create awesome content that allowed this 1st year educator to spend less time planning and more time educating!
Seasons Activities
Seasons Interactive Notebook Pages – simple INB pages on seasons
Complete 5E Lesson on Seasons – PowerPoint, notes, homework, assessments, student-choice projects, modified notes, engagement activity, objectives, word wall, and more
Chris Carrell Bio
Chris Carrell (@mr.cscienceljhs), or Mr. C to his students, is an 8th grade Science educator at Llano Junior High School in the heart of the Texas hill country. Chris earned his Bachelors in Conservation, Ecology, and Evolutionary Sciences and a Masters in Wetland Biology from Southeastern Louisiana University. Before becoming an educator, Chris worked for numerous state and government agencies and private companies as a Wildlife Biologist. Although this is Chris’s first year as an educator, he was named Educator of the Year by the Llano Chamber of Commerce. He prides himself in bringing the most up to date technology and teaching methodologies to his classroom to engage and instill a love for science in his students. In his spare time (what is that?!), he enjoys day-tripping through the Texas hill country with his amazing 3 year old daughter Elliott and beautiful wife Ashley.
Download Over $100 in FREE Resources
For Middle School Science
Simply create a login below and gain immediate access to a selection of our Kesler Science product line worth $100 - for FREE. There's a full version of every product type! You'll also join tens of thousands of middle school science teachers who receive timely tips and strategies straight to their inbox.


